Our business model is built to create and sustain value – for our clients, our people, and our shareholders. It enables the group to leverage its systems and capabilities to unlock opportunities, manage risk, and deliver long-term growth. Guided by clear strategic focus areas, we make decisions that balance performance with sustainability. The way we engage with the key resources and relationships our business depends on – our people, partners, clients, data and infrastructure – ultimately determines our ability to create, protect and grow value over time.
Our capitals
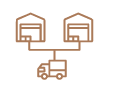
The group connects brands to retail channels and shoppers. Its end-to-end capabilities span selling and tailored distribution models, warehousing and logistics, retail execution and merchandising. Beyond operational delivery, the group adds value through shopper marketing and activation, advisory and training, point-of-sale and promotional support, as well as data, technology and analytics solutions that drive smarter decisions and measurable growth.
We deliver value through
- Strategic, invested leadership & a quality workforce: Learn, share & collaborate = better client solutions.
- Broad trade coverage: From main market, convenience and HORECA to wholesale, formal and corporate stores.
- Deep local market, country knowledge & understanding, gained over decades.
- Client-focused: Retention spanning decades. Ability to deliver multi-market solutions.
- Established customer relationships & regional connectivity: A powerful, unmatched competitive advantage.
- Operational efficiency: Solid infrastructure, developed processes, digitally evolving & entrepreneurial approach.
- Good financial health: Healthy balance sheet, strong operating cash flow for responsible capital allocation.
- Connectivity across markets: Local expertise, connected at scale and powered by insight delivers value greater than the sum of its parts.
Our route-to-market solutions key
Warehousing and distribution
Retail execution and advisory services
Retail support services and training
Technology and data solutions


Outcomes – Value created for stakeholders
A low-risk, sustainable business with increased emerging market coverage in Southern and East Africa.
- 481 218 764 number of ordinary shares (2024: 478 917 481)
- Headline earnings per ordinary share at 143.72 cents (2024: 122.71 cents)
- 20% return on equity (2024: 21%)
- Dividends per ordinary share declared at 28.69 cents (2024: 24.44 cents)
- Share price at year end at R14.84 (2024: R16.20)
- Gearing ratio at -18% (2024: -15%)
A preferred employer, fostering a high-performance culture that recognises and rewards exceptional performance. Mentorship and personal development opportunities.
- 15 355 employees trained (2024: 8 693)
- 248 employees promoted (2024: 201)
- 184 employees retrenched (2024: 56)
- Employee retention at 87.8% (2024: 90.9%)
A responsible business that contributes to the economy and to sustainable development.
- Contribution through taxes and levies at R580 million (2024: R529 million)
- Fines and penalties at R0.6 million (2024: R4.1 million)
Increased market share through speed of distribution and reduced cost-to-market.
Ability to exponentially increase sales by leveraging unique technologies, data and insights.
- Revenue growth of 2.3% (2024: 10.6%)
- Products delivered to number of outlets – 20 772 (2024: >5 350)
- Retail execution services in number of outlets – 48 317 (2024: >34 676)
- 1 757 brands represented (2024: 1 750)
- Progress key:
- Value created
- Value preserved
- Value eroded
Managing trade-offs to deliver strategic growth and long-term value
Our primary purpose and business model focus is on efficiently converting resources into value across all six capitals. As we allocate resources in accordance with our strategy and governance framework, trade-offs become crucial. This involves balancing resources and outcomes over time. These decisions can be challenging, especially when dealing with competing stakeholder interests.
Standardisation vs local adaptation
Short-term profitability vs long-term sustainability
The group faces the challenge of deciding whether to pursue immediate profits through aggressive strategies or prioritise long-term sustainability. Opting for a sustainable approach may involve sacrificing short-term gains in favour of ensuring long-term stability.
In-house development vs outsourcing
This trade-off involves deciding whether to develop capabilities in-house for greater control or to outsource certain functions to leverage external expertise and reduce costs. Finding the right balance is key, keeping core functions in‑house for control while outsourcing non-core activities where external expertise can enhance efficiency.